
- November 2012
Over the last few years if you live along Lake Michigan or Lake Huron you’ve probably noticed a big swing in the water levels and therefore the size of the beaches. Why both of these lakes? They are the same body of water only separated by the Mackinaw Straights. And while the other lakes have also been higher than they have been since 1998 they are at different elevations from Lake Michigan and Huron.
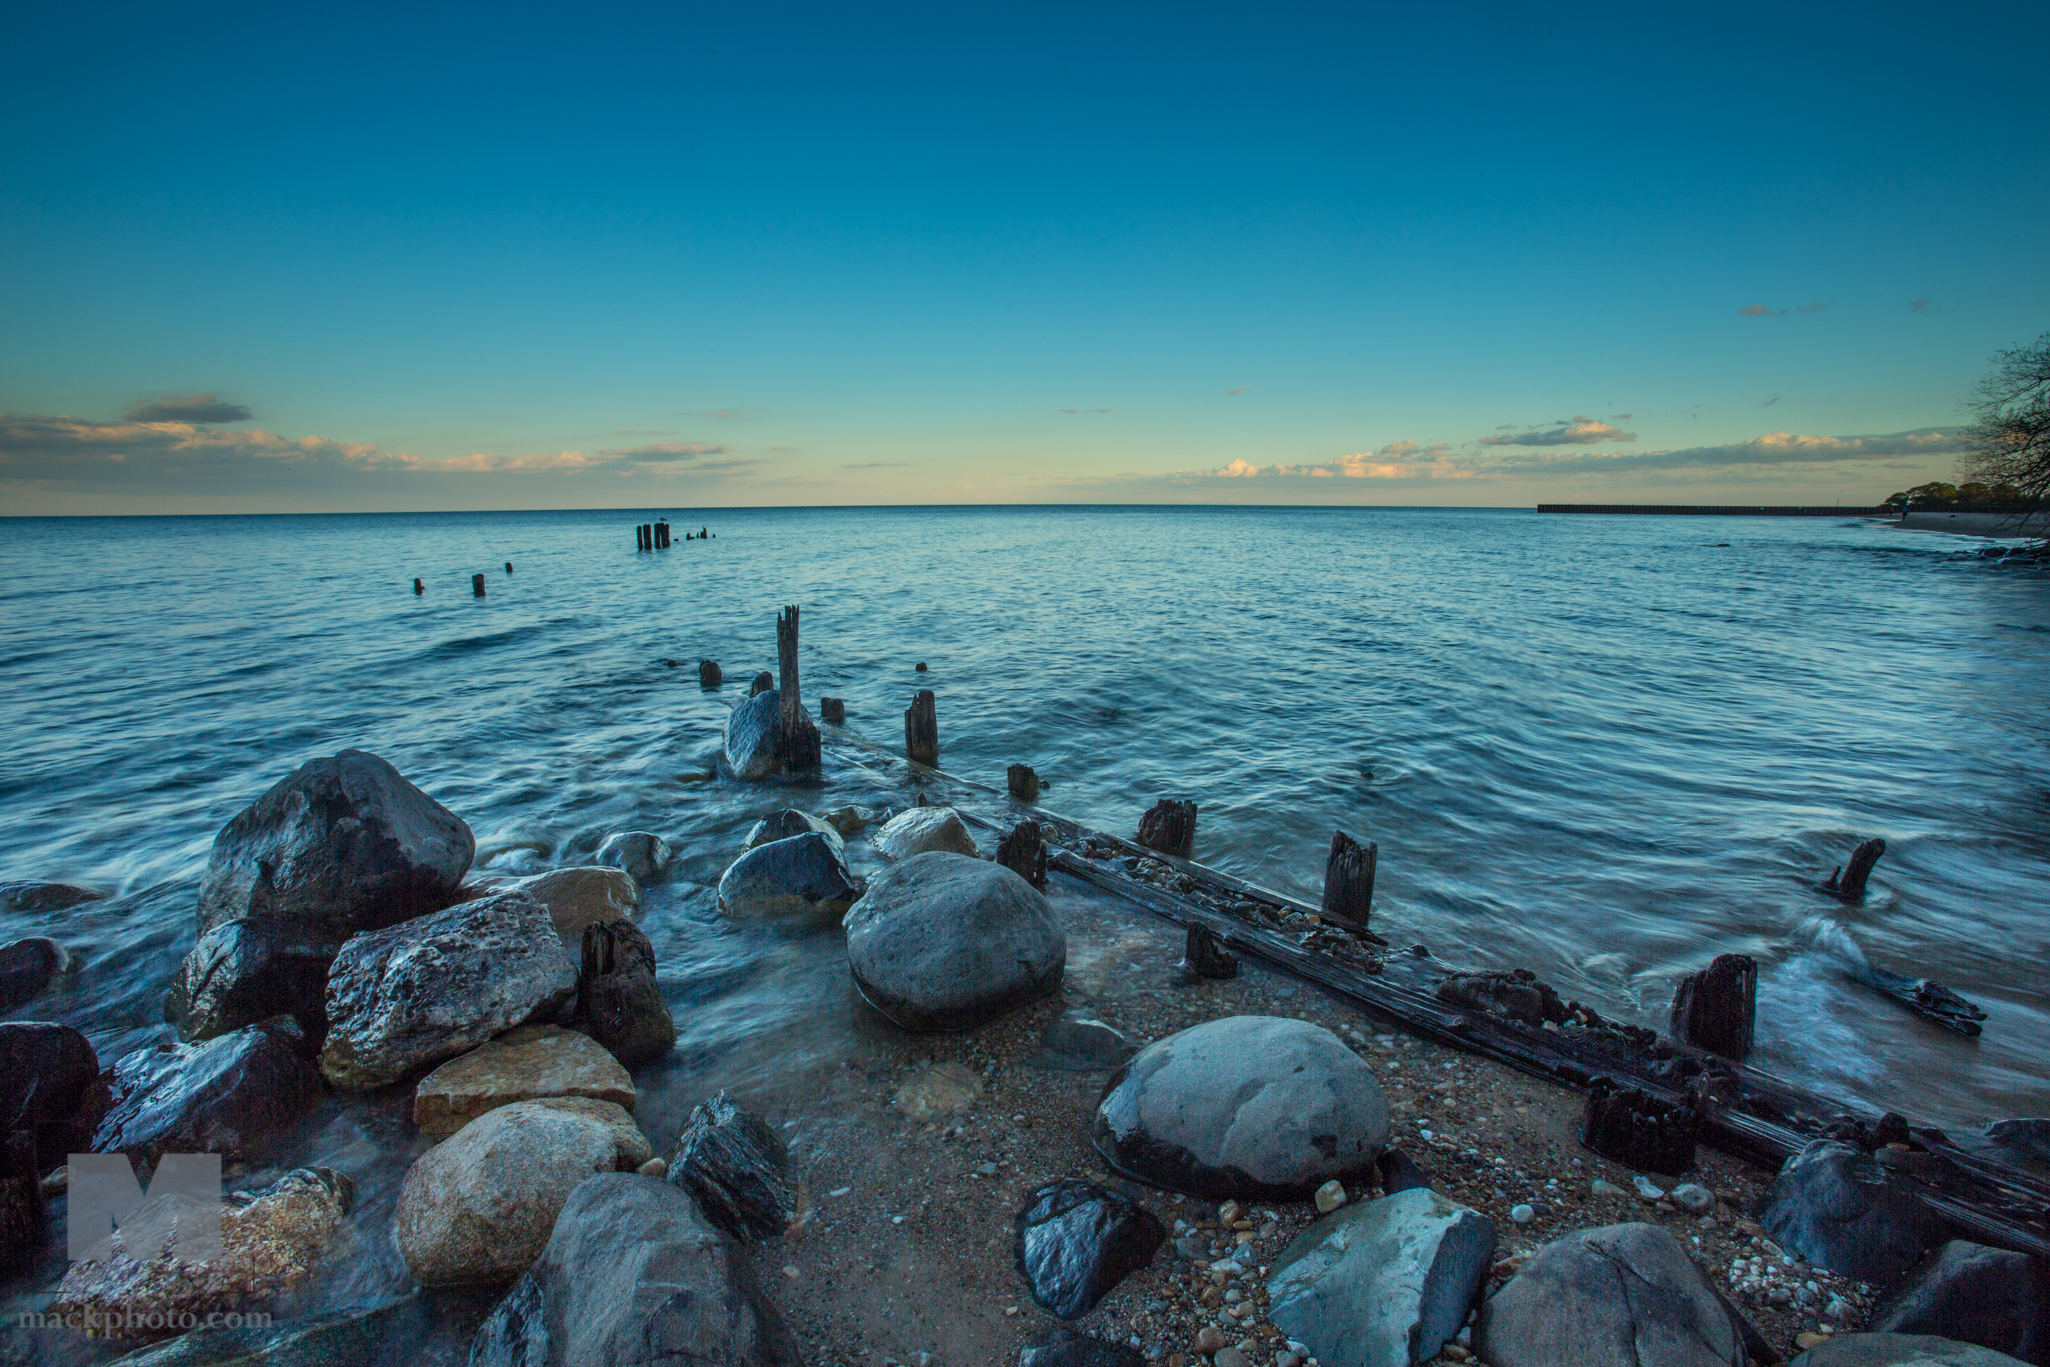
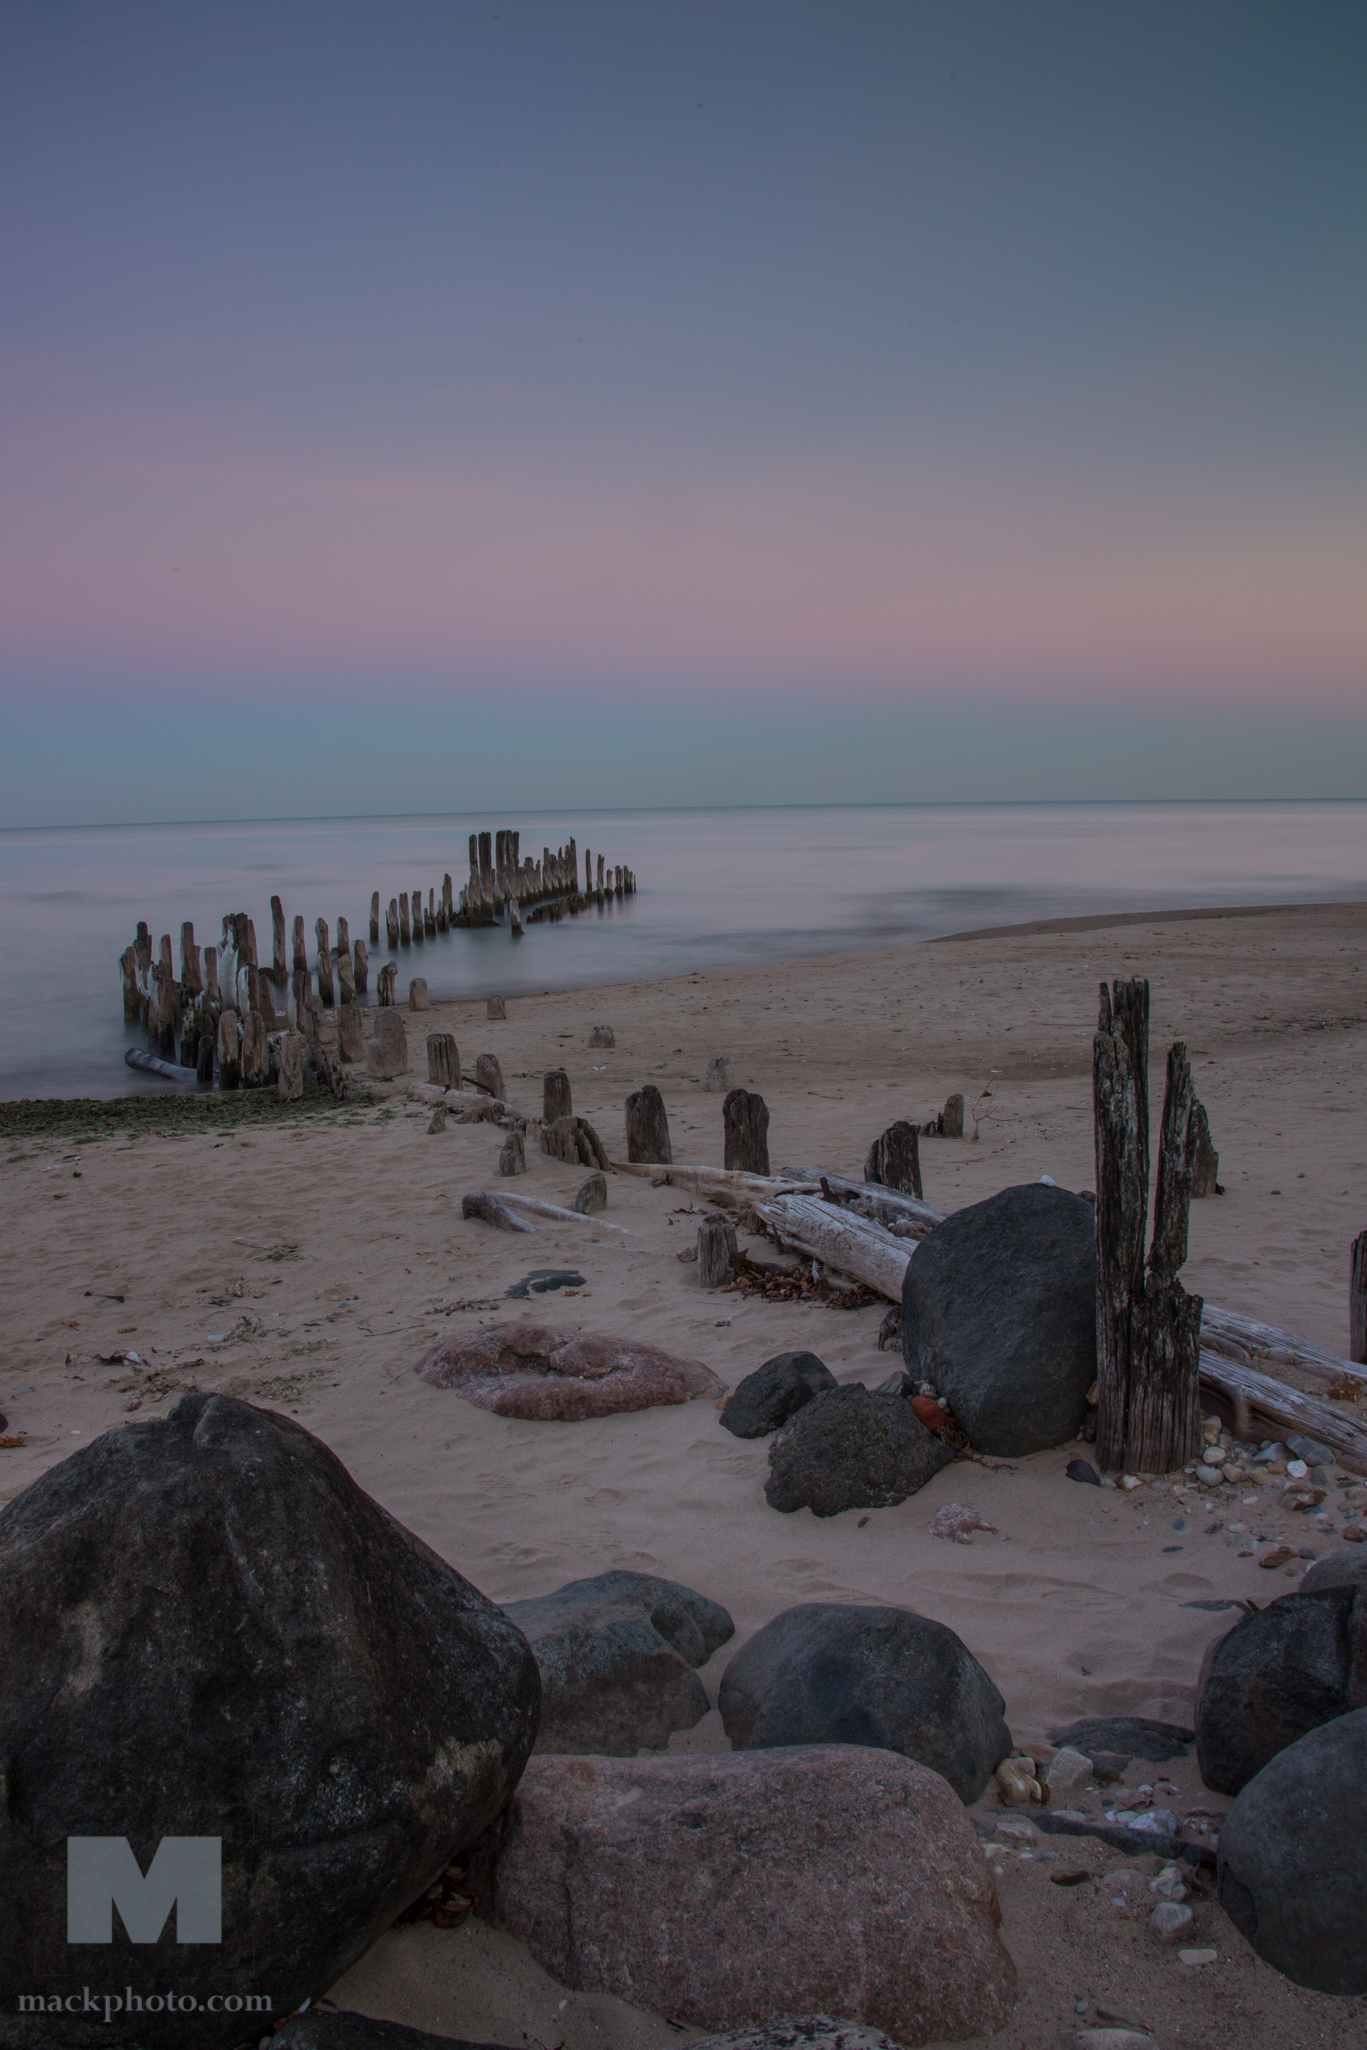
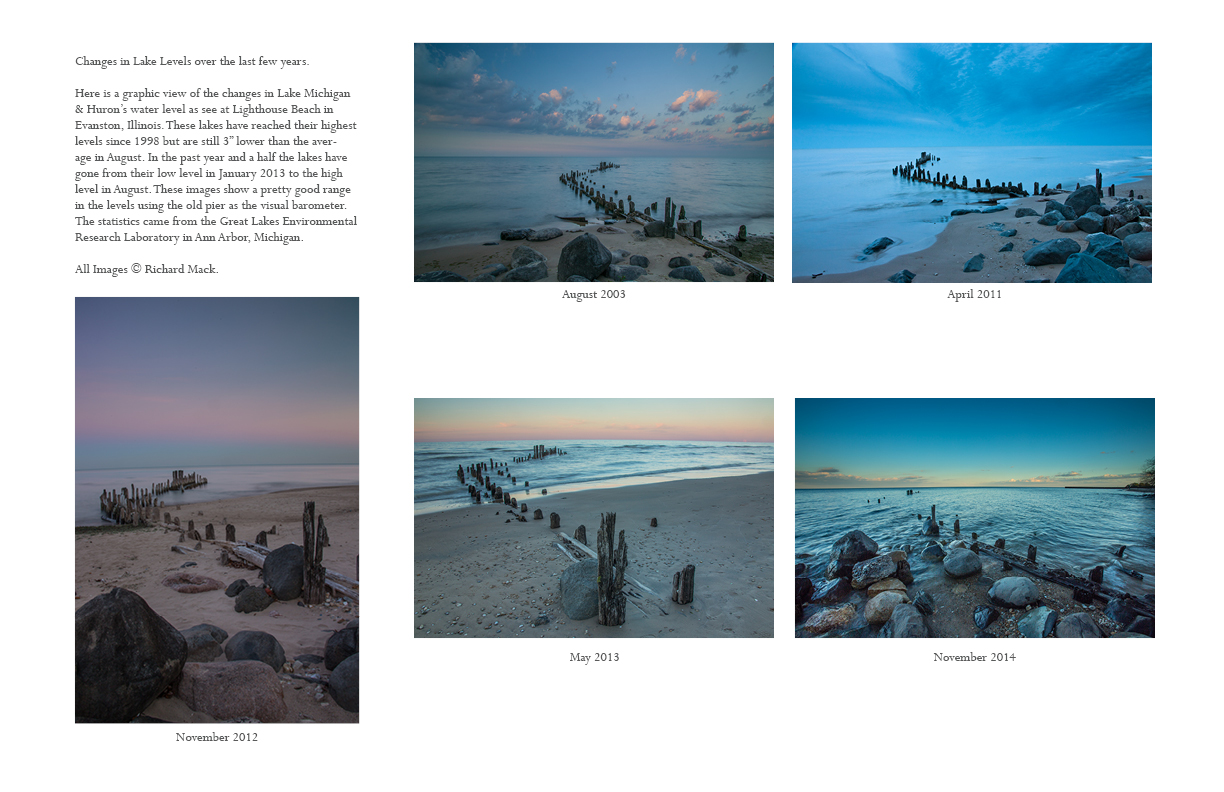
Here is a graphic view of the changes in Lake Michigan & Huron’s water level as see at Lighthouse Beach in Evanston, Illinois. These lakes have reached their highest levels since 1998 but are still 3” lower than the average in August. In the past year and a half the lakes have gone from their low level in January 2013 to the high level in August. These images show a pretty good range in the levels using the old pier as the visual barometer.
- October 2014
As I have shot at this pier since 2003 as part of my personal work and more often as part of the Great Lakes Project The Sweetwater Seas, I have been interested in the ebb and flow of the water levels and the amount of beach I could see. As you can see there was a difference from the low in November 2012 and May 2013 (around the lowest period) where the sand stretched out about 20 feet more. The images also show you the way the water covers or doesn’t cover the old piers pilings as well. In nature nothing stays the same for very long.
Why has there been so much fluctuation? Because over the past 18 months we had a winter where close to 95% of all the surfaces on the Great Lakes were frozen over. Therefore the evaporation could not take place over the winter. And as we all know, this summer has been cooler and wetter than average. Making for a net gain in the amount of water in the Great Lakes Watershed.
Enjoy,
Richard
The statistics came from the Great Lakes Environmental Research Laboratory in Ann Arbor, Michigan.
All Images ©2014 Richard Mack.